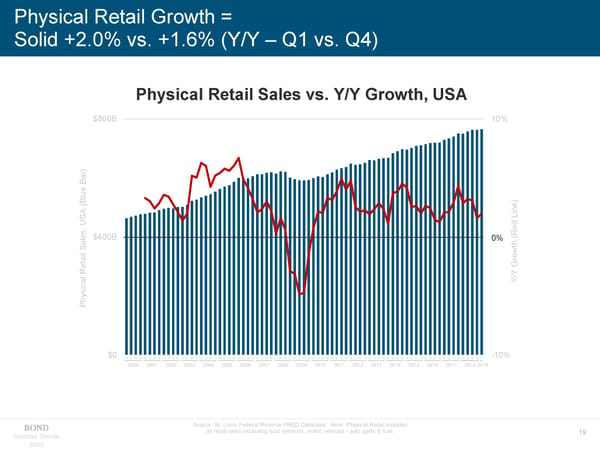
Physical Retail Growth = Solid +2.0% vs. +1.6% (Y/Y – Q1 vs. Q4) Physical Retail Sales vs. Y/Y Growth, USA $800B 10% ar) B ue l ) B ( ne A Li , US Red es $400B 0% ( al 0% th S l i ow r G Reta /Y al Y c i s hy P $0 Q1Q2Q3Q4Q1Q2Q3Q4 Q1 Q2 Q3 Q4 Q1 Q2 Q3 Q4 Q1 Q2 Q3 Q4 Q1 Q2 Q3 Q4 Q1 Q2 Q3 Q4 Q1 Q2 Q3 Q4 Q1 Q2 Q3 Q4 Q1 Q2 Q3 Q4 Q1 Q2 Q3 Q4 Q1 Q2 Q3 Q4 Q1 Q2 Q3 Q4 Q1 Q2 Q3 Q4 Q1 Q2 Q3 Q4 Q1 Q2 Q3 Q4 Q1 Q2 Q3 Q4 Q1 Q2 Q3 Q4 Q1 Q2 Q3 Q4 Q1 -10% 2000 2001 2002 2003 2004 2005 2006 2007 2008 2009 2010 2011 2012 2013 2014 2015 2016 2017 2018 2019 Source: St. Louis Federal Reserve FRED Database. Note: Physical Retail includes all retail sales excluding food services, motor vehicles / auto parts & fuel. Internet Trends 19 2019
 Internet Trends - Mary Meeker Page 18 Page 20