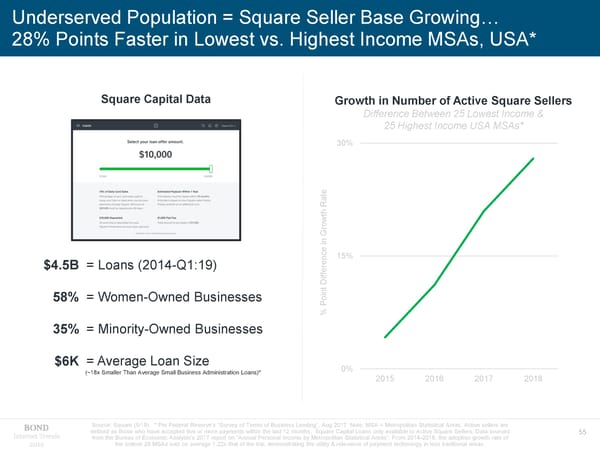
Underserved Population = Square Seller Base Growing… 28% Points Faster in Lowest vs. Highest Income MSAs, USA* Square Capital Data Growth in Number of Active Square Sellers Difference Between 25 Lowest Income & 25 Highest Income USA MSAs* 30% Rate th ow r G n i e 15% $4.5B = Loans (2014-Q1:19) erenc f f Di nt 58% = Women-Owned Businesses i % Po 35% = Minority-Owned Businesses $6K = Average Loan Size 0% (~18x Smaller Than Average Small Business Administration Loans)* 2015 2016 2017 2018 Source: Square (5/19). * Per Federal Reserve’s “Survey of Terms of Business Lending”, Aug 2017 Note: MSA = Metropolitan Statistical Areas. Active sellers are defined as those who have accepted five or more payments within the last 12 months. Square Capital Loans only available to Active Square Sellers. Data sourced Internet Trends from the Bureau of Economic Analysis’s 2017 report on “Annual Personal Income by Metropolitan Statistical Areas”. From 2014-2018, the adoption growth rate of 55 2019 the bottom 25 MSAs was on average 1.22x that of the top, demonstrating the utility & relevance of payment technology in less traditional areas.
 Internet Trends - Mary Meeker Page 54 Page 56