
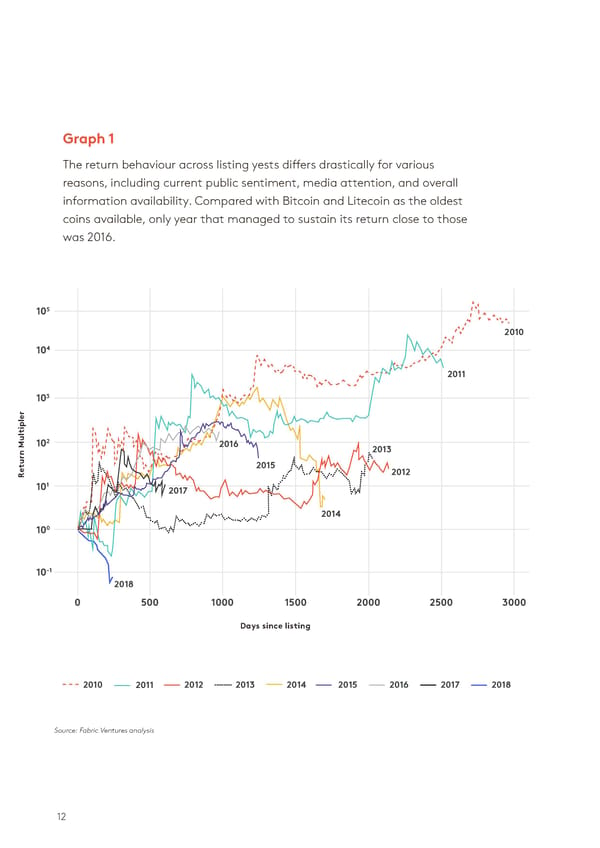
Graph 1 Graph 2 The return behaviour across listing yests differs drastically for various Narrowing down the focus on tokens that remained listed for at least 250 reasons, including current public sentiment, media attention, and overall days, the average price performance of tokens listed in 2018 appears to be information availability. Compared with Bitcoin and Litecoin as the oldest the lowest. In a similar fashion, year 2011 (Litecoin) ended up in negative coins available, only year that managed to sustain its return close to those during it’s first 250 days. Tokens listed in 2017 achieved the highest average was 2016. return of over 10x, followed closely by year 2010 (Bitcoin), and average returns in 2012, 2013, 2015, and 2016. Tokens listed in 2014 resulted in null returns in their first 250 days from listing. 5 10 2013 2010 2017 4 1 10 10 2012 2011 2016 3 2010 2015 10 r r le le p p i i t t l l u u 2014 2 0 M 10 2016 2013 M 10 n n r r u 2015 u et 2012 et R R 1 10 2017 2011 2014 0 -1 10 10 2018 -1 10 2018 0 500 1000 1500 2000 2500 3000 0 50 100 150 200 250 Days since listing Days since listing 2010 2011 2012 2013 2014 2015 2016 2017 2018 2010 2011 2012 2013 2014 2015 2016 2017 2018 Source: Fabric Ventures analysis Source: Fabric Ventures analysis 12 13
 State of the Token Market Page 11 Page 13