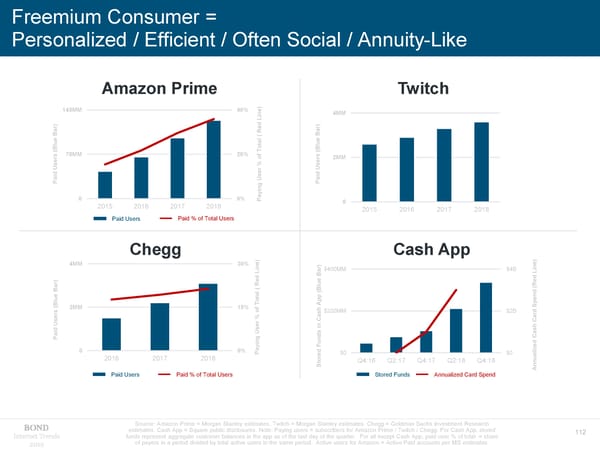
Freemium Consumer = Personalized / Efficient / Often Social / Annuity-Like Amazon Prime Twitch ) 140MM 40% e 4MM 40% in L ) ) Red Bar Bar ( e l e a t Blu o Blu ( T ( s 70MM 20% f s r o r 2MM 20% % Use Use r id id a Use a P P g in y 0 0% a P 0 0% 2015 2016 2017 2018 2015 2016 2017 2018 Paid Users Paid % of Total Users Chegg ) Cash App ) 4MM 30% e ) e in $400MM $4B in L L Bar ) Red e Red ( Bar ( Blu l ( d e a n t p e o p p Blu T A ( S 2MM 15% f h s o $200MM $2B d r % Cas Car Use r in h id a Use s d Cas P g n in u d y F a ze 0 0% P d $0 $0 li e a 2016 2017 2018 r u o Q4:16 Q2:17 Q4:17 Q2:18 Q4:18 n t n S A Paid Users Paid % of Total Users Stored Funds Annualized Card Spend Source: Amazon Prime = Morgan Stanley estimates. Twitch = Morgan Stanley estimates. Chegg = Goldman Sachs Investment Research estimates. Cash App = Square public disclosures. Note: Paying users = subscribers for Amazon Prime / Twitch / Chegg. For Cash App, stored Internet Trends funds represent aggregate customer balances in the app as of the last day of the quarter. For all except Cash App, paid user % of total = share 112 2019 of payers in a period divided by total active users in the same period. Active users for Amazon = Active Paid accounts per MS estimates.
 Internet Trends - Mary Meeker Page 111 Page 113